It is interesting to see how digital tools and today’s development of technology affect the field of archaeology. In today’s digital world, archaeology meets a lot of “grand challenges” that are related to humanities – to be specific, people, trends, order, culture, and environment (those are my summarization for the 5 categories of “Grand Challenges”). Data plays an important rule in archaeology research. Since the middle of the 20th century, archaeologists collected massive amounts of data, and these help researchers to answer unsolved historical mysteries, meanwhile with a “multi-/inter-/transdisciplinary collaboration” to optimize the research methods.
The similar direction of thought exists in the world of art and design, including visual arts, interaction/UI/UX design, etc. Digital art isn’t a new thing, either. Since computer became a thing, artists started getting involved with computer graphics, photography, animations, and film-making. However, it became an approachable thing for most of us since the beginning of the 21st century, with the popularization of the personal computer and mobile devices.
Using Digital tools to implement arts and design brings convenience for creators and evolves the whole industry, but it also comes with a few issues.
One example is the research study for the User Interface/User Experience Design, including product design, web/app design, etc. Just like archaeology researches which also needs the support by other fields of study like molecular anthropology and material culture (Kintigh, p.10), UI/UX research also has this interdisciplinary characteristic – it mixed with graphic design/visual communication design, interaction design, and psychology. It is also an important component of the study of HCI/Human Factors. A product with a great UX will make us think the product “understand” you in both visual comforts and a psychological aspect. However, how to make a user-friendly interface? How to make it easy to use for end users?
To make the product “understand” us, the person or the team (we call them UI/UX designers, or even product managers) who makes the product need to study about human.
A faster way to study human is to using digital tools. One important thing that we need is data. Data comes from the experiment from our participants. Like any research, participants are helpful for either testing a product, prove something is right or wrong, or even find out some principles that could apply – like this example that I’ll talk about – people’s habit of browsing a webpage. Using the data collected from the experiments and applying data analysis, we will get a persuasive conclusion.
Applying Data Analysis for UX research
The study of User Experience focuses on how people will interact with the product, including websites. A great web design will make the content easy to read. Also, for businesses, the webpage layout should match the user’s reading habit, so that important information will not be missed.
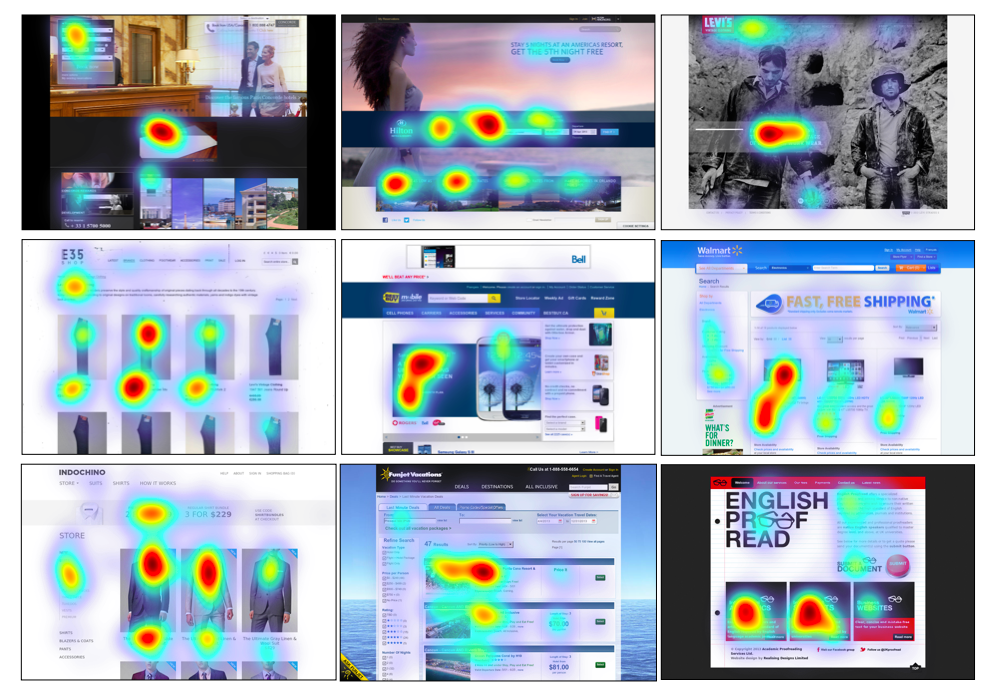
A 2006 study by Nielsen Norman Group (a UX research group) found that an “F-shaped pattern” is the primary reading pattern for most readers. (Nielsen, 2006) Using the eyetracking technique, researchers collected data from participant’s eyetracking results for three major user scenarios – A plain text article, an article with a picture and a Google search result. They analyze these data and created a “heat map” that demonstrates the frequency of which parts are mostly being read, or we can say, which parts in the webpage are mostly seen.
![]()
The discovery of the “F-shaped pattern” could help the web designer, marketer, and editor to optimize the structure of contents, and attract visitors to read as more important information as possible.
While there are some arguments (I’ll talk about that later) states that the “F-shaped pattern” is not the only principle to follow, this psychological find still helped a lot of web designers and delivers a huge influence over the past 12 years.
In conclusion, with the support of data, digital tools, and the collaboration with allied disciplines, Digital Humanities will affect how we do researches in any fields.
Extended Talk: About the Argument on “F-shaped Pattern”
The discovery of “F-shaped Pattern” sounds very persuasive because the result is based on the eyetracking experiment from 232 participants. However, another study from EyeQuant has an opposite view and stated that designer shouldn’t completely rely on “F-shaped Pattern”. (Morrison, 2017) EyeQuant used the similar data analysis technique and turns out that they got a lot of new patterns in different scenarios, and these examples are different from what Nielson Norman used. Instead, it seems like “F-shape” is not applicable to online shopping and book flights or hotels.
My opinion is, it really depends on the layout of the webpage. “F-shaped pattern” could be considered in some cases, like news articles, but not for some special layouts that are being used in photo galleries, shopping, etc.
Source:
Jakob Nielsen, F-Shaped Pattern For Reading Web Content (original study), https://www.nngroup.com/articles/f-shaped-pattern-reading-web-content-discovered/
Kurtis Morrison, Eye Tracking Studies: Does the Famous F-shape Pattern Really Exist?, http://www.eyequant.com/blog/eye-tracking-f-shape-pattern-data
